Public and private payers incentivizing providers (P4P) to coax desired clinical behaviors have failed. Both CMS derived measures and those used by commercial insurers, many of which overlap, fail to pass Good Housekeeping standards and lack the reliable characteristics indicators must possess.
Whether those indicators are valid, attributable, or meaningful makes all the difference in the world. If they are not, providers become doubters and scornful.
The NEJM recently published a short and often cited piece from the American College of Physician’s assessing CMSs Merit-based Incentive Payment System (MIPS)/Quality Payment Program (QPP) and the array of indicators associated with them. Click the link and view the table. The ACPs findings do not inspire.
When it comes to hospital-based specialties, like emergency and hospital medicine, radiology, or critical care, how do you, a) find a reliable measure, and b) then make it work for everyone– hospital, group, and individual alike? You cannot, and based on what you read, you will see contradictions. “Yes, the measure is not perfect, but it’s all we got,” or “Absolutely, x causes y—because how could it not,” make it a hard sell for leaders who know better.
Many organizations have abandoned the routine of applying measures at the physician level, for the above reasons and others because they know the risks of breeding cynicism and perpetuating checkbox medicine are too high. Unfortunately, as the comments on many clinical oriented social media boards show, some hospitals and systems continue with the practice.
The Annals of IM just published a study to take note of (if you care about this stuff), and requires HM leaders and QI boffins to take stock of their dashboards; it led me to another paper by one of the same authors, similar in design but 100% pure hospital-based, and demonstrates why tagging indicators to individual providers is wrongheaded.
Hospitals, regulators, and payers place a high premium on mortality and readmit rates—not because they are ideal, but because they are claims-based (easy to cull) and if low, contribute to better rankings, enhanced reputation, and bolster the bottom line. If hospitals participate in ACOs or in the MSSP program, length of stay and discharge to home also carry increasing weight due to their impact on global payments.
In the Annals study, the trialists sought to determine variation in readmit rates amongst 4000+ individual PCPs. They found at the 10th, and 90th percentiles PCP readmit rates were 12.4% and 13.4%, respectively, each only 0.5 % different from the mean.
How should you interpret the findings? For one, do not place PCPs at risk for variation that has more to do with randomness than the care they deliver. The authors also indicate that to detect a 1.1% difference from their mean adjusted readmission rate, a PCP would require a sample of >3500 admits per year. Good luck with that.
How about hospitalist care?
Unlike cancer screening rates and BP measures, readmit and mortality rates, LOS, and discharge to home don’t woo ambulatory docs to performance dashboards as they do for hospitalists. This study from JGIM, however, should give you pause.
The investigators performed an analysis similar to the Annals trial, but for 1100 Texas hospitalists (totaling 132K admits) rather than outpatient-focused PCPs. The outcomes they studied were LOS, discharge destination (post-acute vs. home), readmit rates, and mortality.
- Avg LOS = 4.2 days (81.5% to home)
- Readmit rate (at 30 days) = 15.8%
- ER f/u rate (at 30 days) = 19.8%
- Mortality (at 30 days) = 7.7%
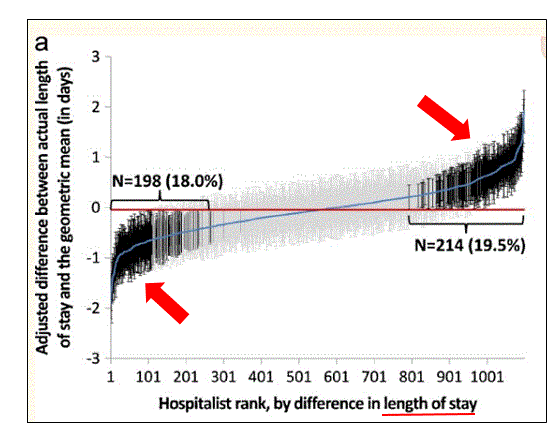
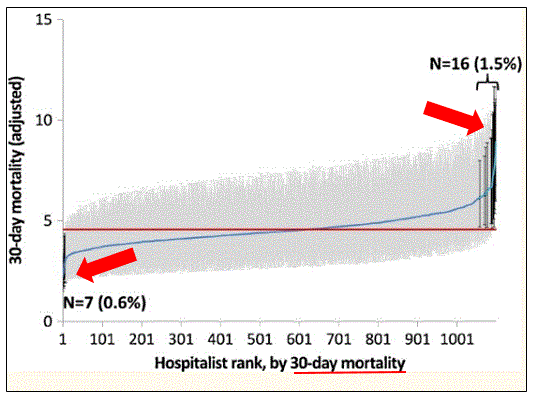
Have a look at the distribution curves for LOS and mortality below:
Figure A.

Figure B.

On LOS, 198 hospitalists (18 %) had significantly shorter LOS, while 214 hospitalists (19 %) had significantly greater LOS (red arrows in Figure A). A similar pattern was seen for patients discharged home and to a SNF, but with much less variation from the mean. However, for readmits, ER visits, and mortality (red arrows in Figure B), the difference was negligible.
The summary is this: LOS and home discharge vary from provider to provider, correlate, and may matter. For the rest of the outcomes, not so much.
Where to go from here?
Yes, there are limitations to the publications such as the cohort years the investigators sampled from, the observational nature of the trials, and whether your region or health system reflects the same care patterns as Texas. But even with these shortcomings, I believe the findings are relevant; both to the dashboards we look at now, in addition to the incentives officials subject hospital-based providers to.
Some outcomes do associate to individuals, and if LOS and discharge destination matter to your organization and you can justify (a big if) using them, fine. But as for the rest, there is too much distance between x, the doctor, and y, the outcome of interest. Internal and external hospital system factors beyond any individuals control insert themselves snugly between the two.
These disagreeable measures are best left to the bean counters and analysts scrutinizing ACO and hospital systems–organizations of suitable scale–rather than the little folks on the front lines.


Leave A Comment